
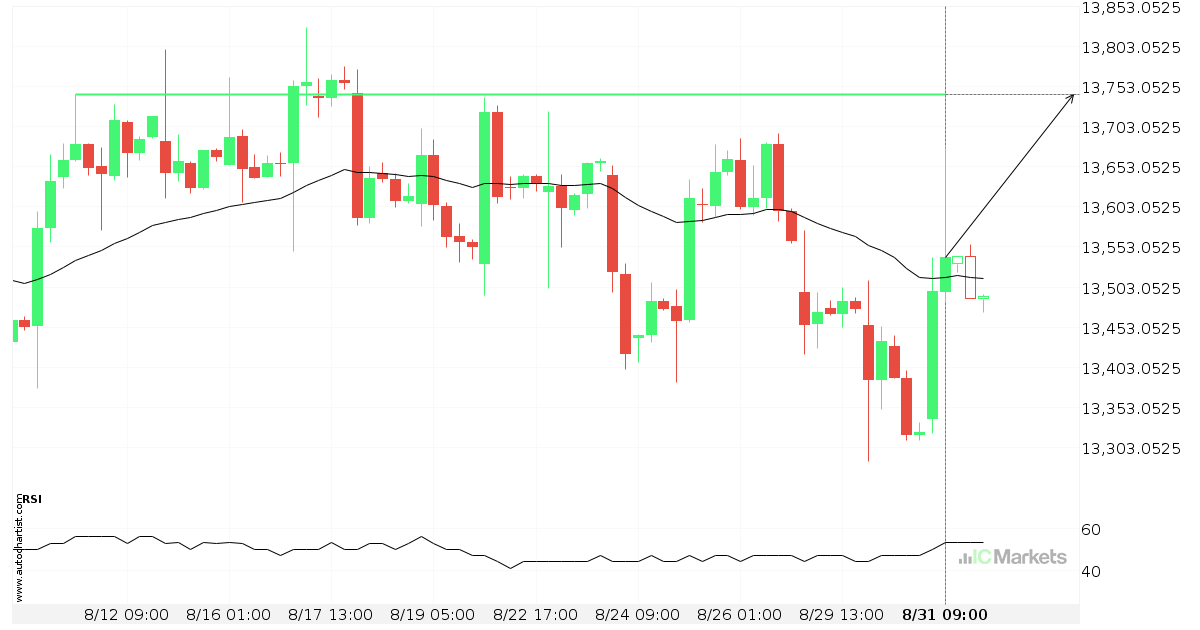
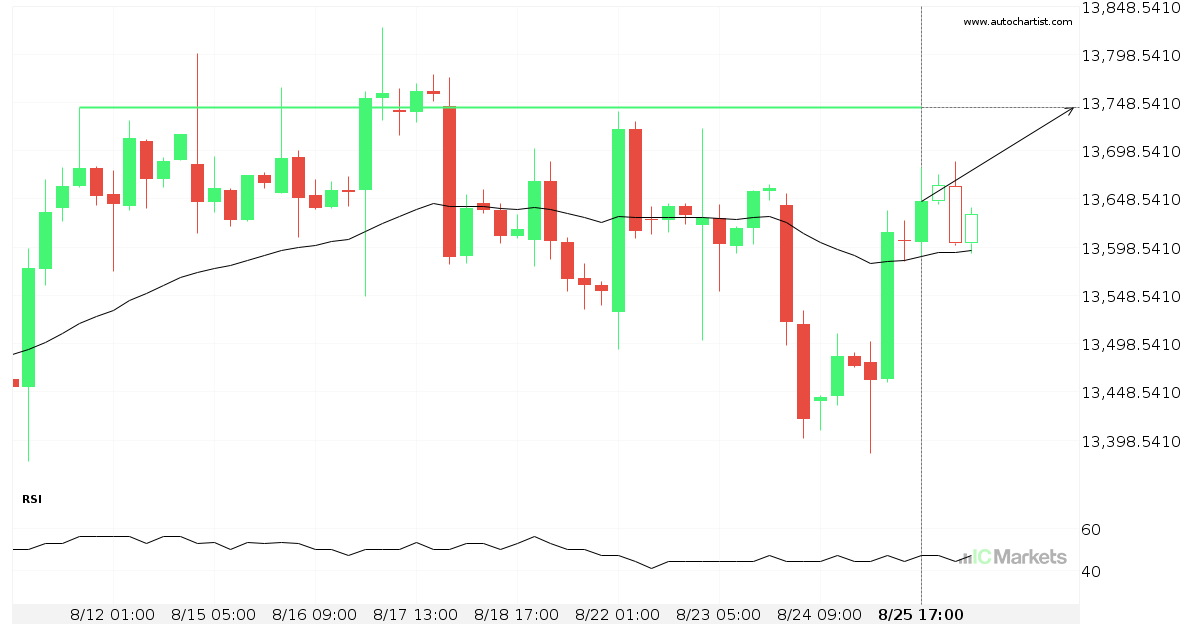
Breach of important price line imminent by FTSE China A50 Index
FTSE China A50 Index is moving towards a line of 13743.4404 which it has tested numerous times in the past. We have seen it retrace from this position in the past, so at this stage it isn’t clear whether it will breach this price or rebound as it did before. If FTSE China A50 Index […]
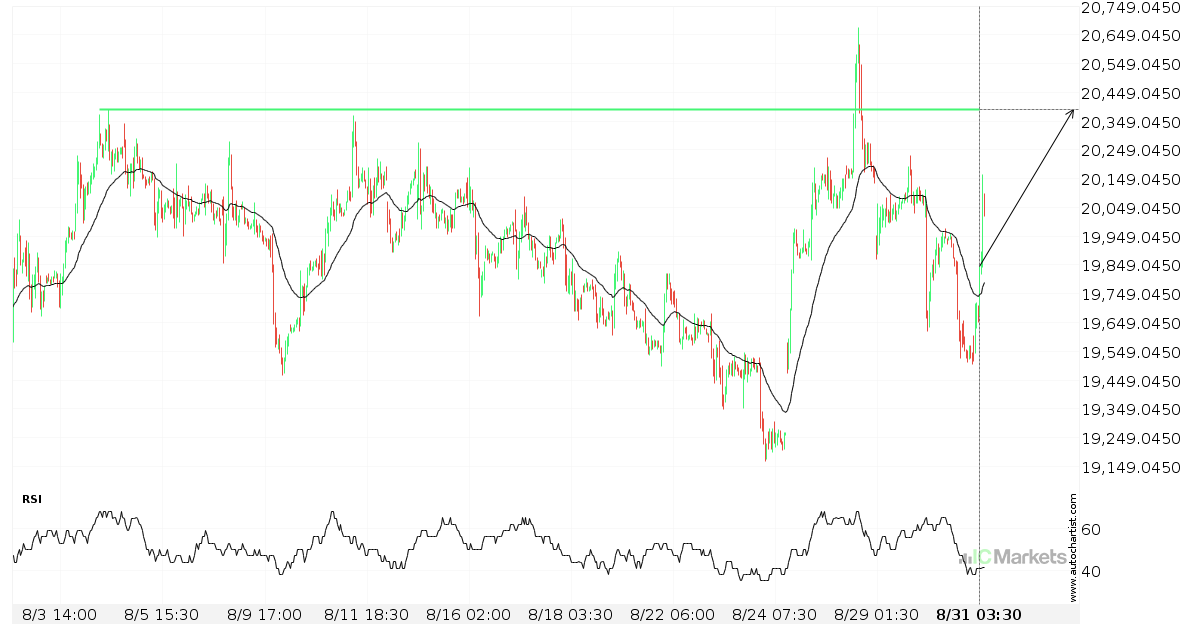
Breach of important price line imminent by Hong Kong 50 Index
Hong Kong 50 Index is moving towards a line of 20388.8008 which it has tested numerous times in the past. We have seen it retrace from this position in the past, so at this stage it isn’t clear whether it will breach this price or rebound as it did before. If Hong Kong 50 Index […]
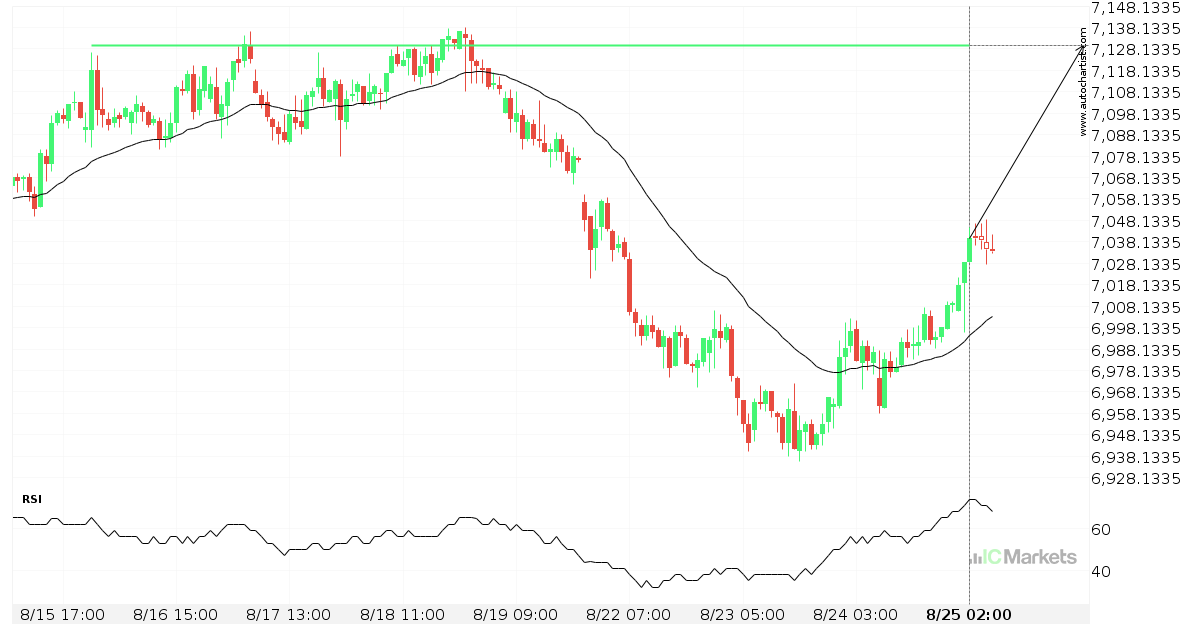
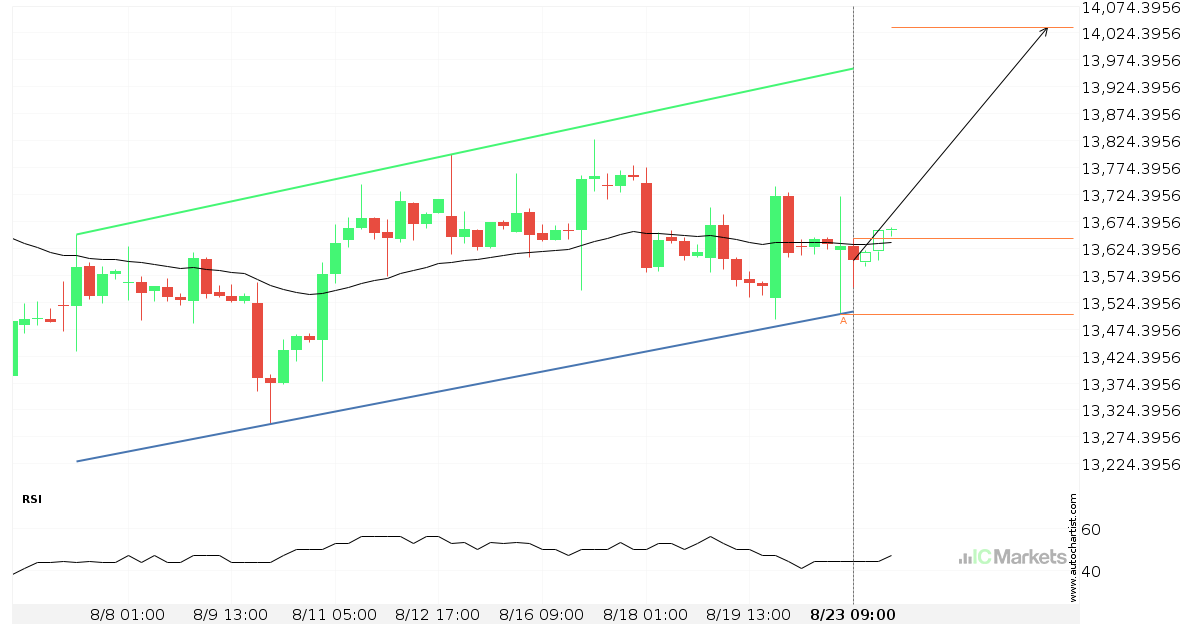
Possible breach of resistance level by FTSE China A50 Index
FTSE China A50 Index is moving towards a resistance line which it has tested numerous times in the past. We have seen it retrace from this line before, so at this stage it isn’t clear whether it will breach this line or rebound as it did before. If FTSE China A50 Index continues in its […]
Will Australia 200 Index have enough momentum to break resistance?
Australia 200 Index is heading towards the resistance line of a Rectangle and could reach this point within the next 2 days. It has tested this line numerous times in the past, and this time could be no different from the past, ending in a rebound instead of a breakout. If the breakout doesn’t happen, […]
What’s going on with Australia 200 Index?
Those of you that are trend followers are probably eagerly watching Australia 200 Index to see if its latest 1.35% move continues. If not, the mean-reversion people out there will be delighted with this exceptionally large 7 hours move.
Breach of important price line imminent by FTSE China A50 Index
FTSE China A50 Index is moving towards a line of 13743.4404 which it has tested numerous times in the past. We have seen it retrace from this position in the past, so at this stage it isn’t clear whether it will breach this price or rebound as it did before. If FTSE China A50 Index […]
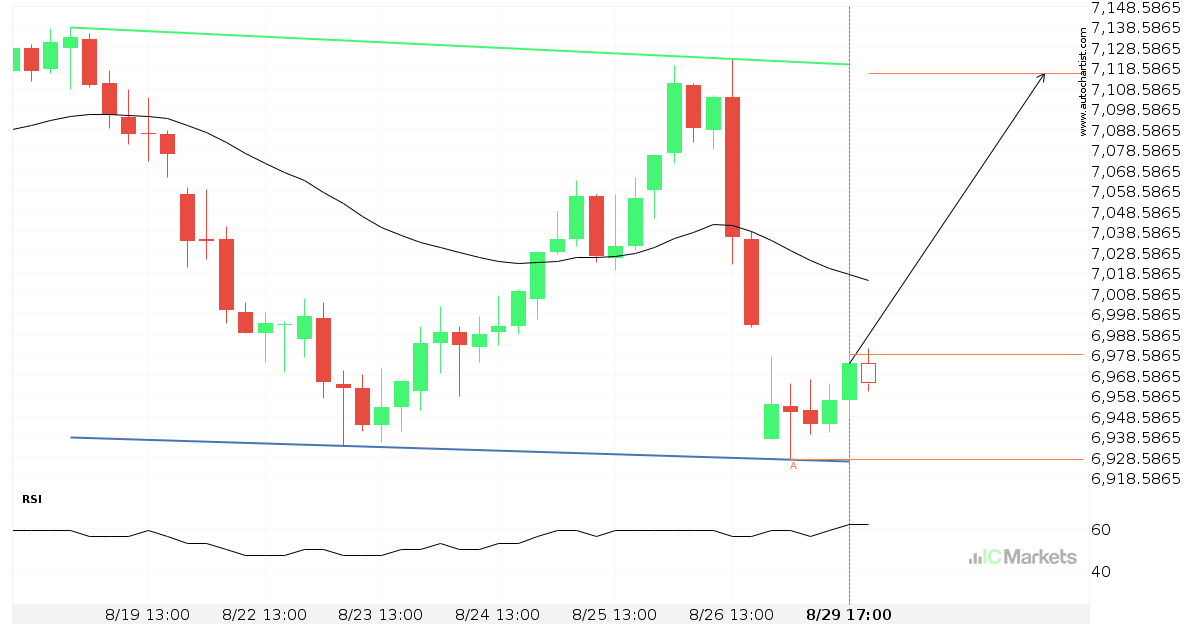
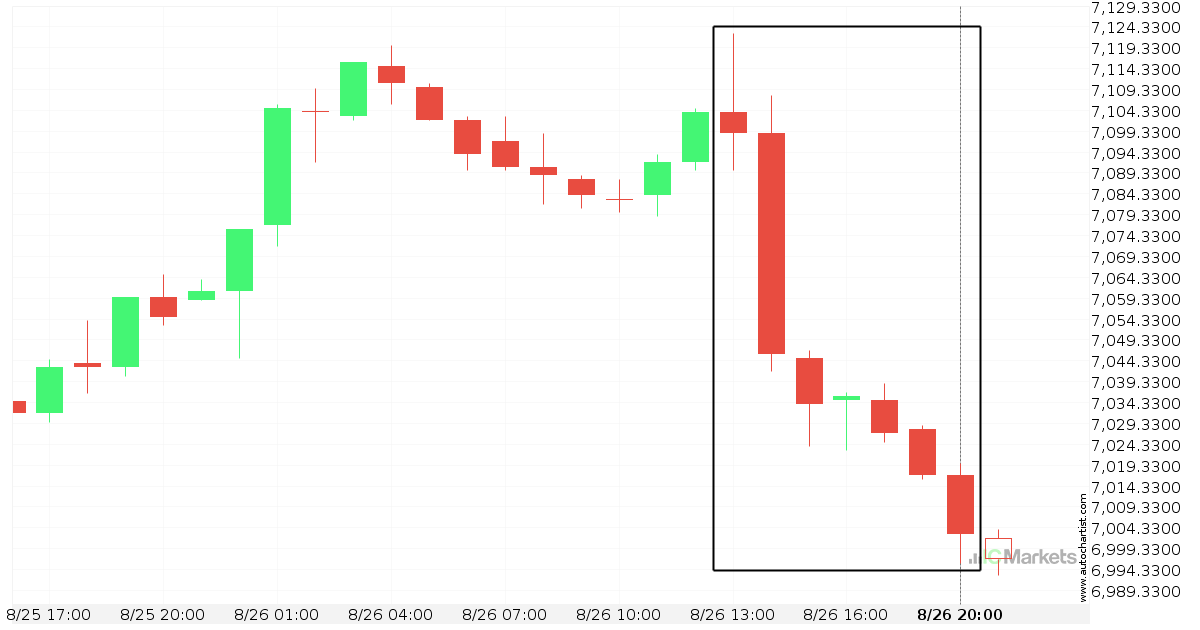
Either a rebound or a breakout imminent on Australia 200 Index
Australia 200 Index is heading towards a line of 7129.7402. If this movement continues, the price of Australia 200 Index could test 7129.7402 within the next 2 days. But don’t be so quick to trade, it has tested this line numerous times in the past, so this movement could be short-lived and end up rebounding.

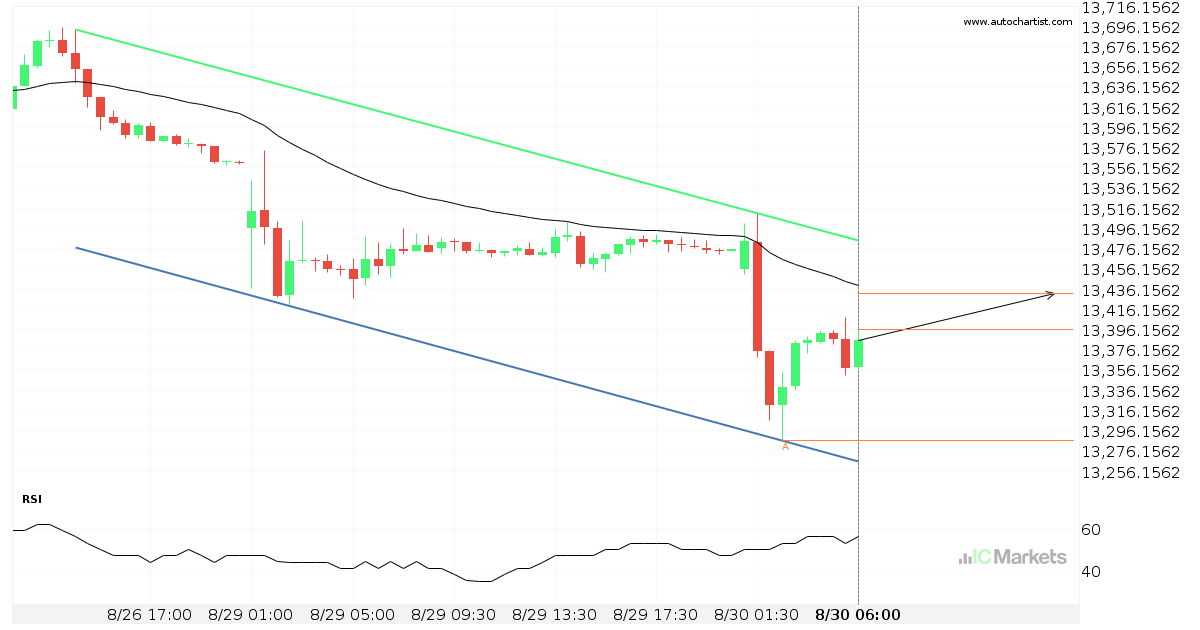
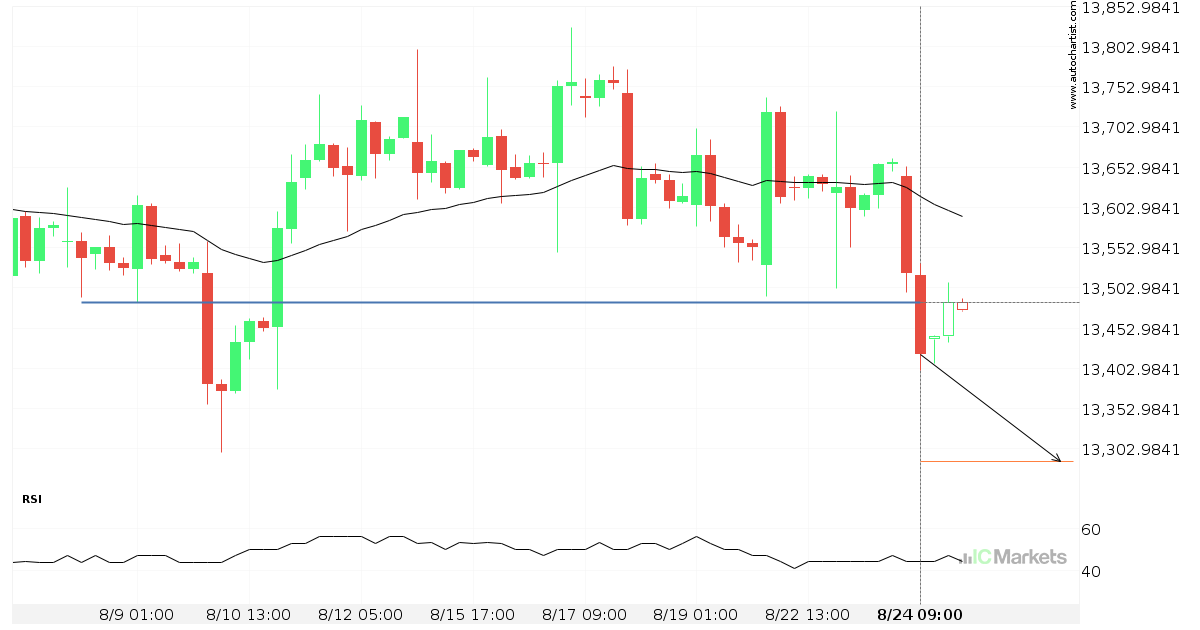
Important price line breached by FTSE China A50 Index
FTSE China A50 Index has broken through 13485.2305 which it has tested numerous times in the past. We have seen it retrace from this price in the past. If this new trend persists, FTSE China A50 Index may be heading towards 13287.5771 within the next 2 days.
Possible breach of resistance level by FTSE China A50 Index
FTSE China A50 Index is moving towards a resistance line which it has tested numerous times in the past. We have seen it retrace from this line before, so at this stage it isn’t clear whether it will breach this line or rebound as it did before. If FTSE China A50 Index continues in its […]